
An average calculator helps you find the average of a set of numbers without adding and dividing them manually. Enter your values and get the arithmetic mean, median, mode, range, and other useful statistics in seconds.
Our free online average calculator can help you analyze test scores, grades, monthly expenses, sales figures, survey ratings, and other numerical data. It accepts numbers separated by commas, spaces, or line breaks, making it easy to enter values copied from a spreadsheet or document.
Along with the average, you can review how your numbers are distributed. Results such as the median, standard deviation, and interquartile range provide additional information that a single average cannot show.
About Average Calculator
An average calculator finds the arithmetic mean of a set of numbers but it can also tell you a lot more about that data than just one number. Enter a list of values (test scores, monthly expenses, daily temperatures, survey ratings, anything numeric) and the calculator returns the mean, along with the median, mode, spread, and several other statistics that give you a fuller picture of your dataset.
This tool is useful anytime you need to summarize a group of numbers: a teacher averaging grades, a student checking a semester GPA input, someone tracking weekly spending, a small business owner reviewing sales figures, or anyone who just wants to double-check a hand calculation. All you need before you start is the list of numbers you want to analyze nothing else is required.
Table of Contents
How to Use the Average Calculator
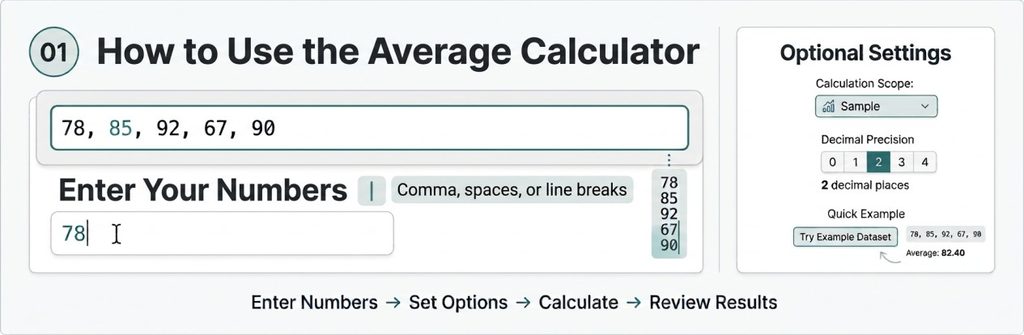
How to Use the Average Calculator
Using this average calculator is straightforward. Follow these steps to calculate the statistics for your numbers.
- Enter your numbers: Type or paste your values into the input box. Separate them with commas, spaces, or line breaks.
- Choose the calculation scope: Select sample or population, depending on whether your data represents a complete group or only part of a larger group.
- Set decimal precision: Choose how many decimal places you want in the results. Two decimal places are generally enough for everyday calculations.
- Try a quick example dataset: If you want to understand how the calculator works, load an example dataset before entering your own values.
- Calculate statistics: Select the Calculate Statistics button to view the results.
The calculator displays the average and other statistical measurements based on the numbers you entered.
Before calculating, check that your input contains the correct values. Avoid adding currency symbols, percentage signs, or other unnecessary characters unless the calculator specifically supports them.
Understanding the Results
An average is useful for summarizing a group of numbers, but other statistics can help you understand the data more clearly. The calculator provides several measurements to show both the center and spread of your dataset.
- Arithmetic Mean (Average): The sum of all values divided by the number of values. It is the most common meaning of average.
- Sample Count (n): The total number of values entered into the calculator. This tells you how many observations are included.
- Median: The middle value after arranging the numbers from smallest to largest. If there is an even number of values, the median is the average of the two middle values.
- Mode: The value that appears most frequently in the dataset. A dataset may have one mode, multiple modes, or no mode.
- Minimum and Maximum: The smallest and largest values in your dataset.
- Range: The difference between the maximum and minimum values. It gives a simple indication of how widely the numbers are spread.
- Sample Standard Deviation: Measures how far values typically vary from the mean when the data represents a sample of a larger population.
- Population Standard Deviation: Measures the spread of values when your dataset represents the entire population being studied.
- Interquartile Range (IQR): Measures the spread of the middle 50% of your data, between the first and third quartiles.
- Geometric Mean: An average calculated using multiplication and roots. It is commonly used for growth rates and other multiplicative data.
- Harmonic Mean: An average that is particularly useful for certain rates, such as average speed over equal distances or price per unit.
- Sorted Dataset: Displays your original values in ascending order so you can check how the calculator interpreted your input.
Each statistic answers a slightly different question. Comparing the mean and median, for example, can help you identify whether unusually high or low values are affecting the average.
The Formula
The arithmetic mean is calculated by adding all the values and dividing the total by the number of values.
Arithmetic Mean Formula:
Mean = Sum of all values ÷ Number of values
In mathematical notation:
[\bar{x}=\frac{\sum x}{n}]
Where:
- (\bar{x}) = Arithmetic mean
- (\sum x) = Sum of all values
- (n) = Number of values
Sample Standard Deviation:
[s=\sqrt{\frac{\sum(x-\bar{x})^2}{n-1}}]
Population Standard Deviation:
[\sigma=\sqrt{\frac{\sum(x-\mu)^2}{n}}]
The main difference is the denominator. Sample standard deviation uses (n-1), while population standard deviation uses (n).
Geometric Mean:
[GM=(x_1\times x_2\times \cdots \times x_n)^{1/n}]
Harmonic Mean:
[HM=\frac{n}{\frac{1}{x_1}+\frac{1}{x_2}+\cdots+\frac{1}{x_n}}]
The arithmetic mean works well for most everyday averages, including grades, expenses, and scores. The geometric mean is useful for multiplicative growth, while the harmonic mean is often appropriate for certain rates and ratios.
Worked Example
Suppose a student receives the following five test scores:
78, 85, 92, 67, 90
To calculate the average, first add all five scores:
78 + 85 + 92 + 67 + 90 = 412
Then divide the total by the number of scores:
Mean = 412 ÷ 5 = 82.4
The student’s average test score is 82.4.
Now arrange the numbers from smallest to largest:
67, 78, 85, 90, 92
The other results are:
- Median: 85, because it is the middle value.
- Mode: No mode, because no score appears more than once.
- Minimum: 67.
- Maximum: 92.
- Range: 92 − 67 = 25.
For the sample standard deviation, calculate how far each score is from the mean, square those differences, add them together, and divide by (n-1).
The sum of squared deviations is 413.2.
Sample variance = 413.2 ÷ (5 − 1) = 103.3
Sample standard deviation = √103.3 ≈ 10.16
This tells us that the average score is 82.4, the middle score is 85, and the scores typically vary by around 10.16 points from the mean.
Common Situations Where This Calculator Helps
An average calculator can be useful in education, personal finance, business, and everyday data analysis.
- Grading and academics: Calculate the average of test scores, quiz results, assignment marks, or other academic results.
- Budgeting: Find average monthly spending, utility bills, or income across several months.
- Business performance: Calculate average weekly sales, customer orders, revenue, or productivity figures.
- Surveys and ratings: Summarize customer feedback, employee ratings, or survey responses.
- Performance tracking: Compare workout times, daily activity measurements, or other repeated results.
- Checking calculations: Verify an average calculated manually or with a spreadsheet.
- Understanding data distribution: Use the median, standard deviation, and IQR to understand how closely values are grouped.
The average gives you a quick summary, while the additional statistics help explain how the individual values are distributed.
Common Mistakes
Even simple average calculations can produce misleading results if the data is entered incorrectly or the wrong statistical method is used.
- Treating the mean as the only useful result: An unusually high or low value can pull the mean away from what is typical. Compare it with the median to understand the difference.
- Averaging percentages from different totals: A score of 80% on a 20-point test is not equivalent to 80% on a 100-point test when calculating an overall result. Use total points earned divided by total points possible when the tests have different maximum scores.
- Choosing the wrong standard deviation: Sample and population standard deviations answer different questions. Select the option that matches your dataset.
- Entering symbols with numbers: Values such as “$120” or “85%” may not be interpreted as intended. Use plain numerical values unless the calculator supports those formats.
- Forgetting or duplicating values: Check the sample count against the number of values you intended to enter.
- Rounding too early: Keep the original decimal values during calculations and round only the final displayed result.
Checking your input before calculating can prevent many common errors.
Simple Average vs. Weighted Average
A simple average gives every value equal importance. A weighted average gives some values more influence based on their assigned weights.
For example, imagine a student’s final grade is based on homework worth 20%, a midterm worth 30%, and a final exam worth 50%.
If the scores are 80, 70, and 90, respectively, the weighted average is:
(80 × 0.20) + (70 × 0.30) + (90 × 0.50) = 81
The result is 81.
A simple average would treat all three scores equally:
(80 + 70 + 90) ÷ 3 = 80
The two results are different because the final exam carries more weight.
This calculator is designed for simple averages, where each entered value has equal importance. If your data needs different weights, calculate a weighted average using the appropriate formula or use a dedicated weighted average calculator.
Accuracy, Assumptions, and Limitations
The calculator uses standard mathematical and statistical formulas. However, the accuracy of the results depends on the quality of your input and selecting the correct calculation settings.
Keep these points in mind:
- Input accuracy: A missing number, typing error, or misplaced decimal can change the results.
- Decimal precision: Results may be rounded for display. The underlying calculation should retain sufficient precision before rounding.
- Sample or population selection: Choosing the wrong calculation scope changes the standard deviation result.
- Geometric mean limitations: The standard geometric mean requires positive values. Zero and negative values are not suitable for the usual calculation.
- Harmonic mean limitations: The standard harmonic mean is generally used with positive, nonzero values. Zero values make its formula undefined.
- Weighted data: A simple average may not be appropriate when observations have different levels of importance.
- Outliers: Extremely high or low values can influence the mean, so the median may provide a better picture of a typical value in some datasets.
For important academic, financial, or business decisions, check whether the selected statistical method matches the question you are trying to answer.
Practical Tips
Use these tips to get more meaningful results from your average calculation.
- Check the sample count: Make sure the number of values shown in the results matches the number you intended to enter.
- Compare the mean and median: If they are close, the data may be relatively balanced. If they differ significantly, investigate whether outliers or skewed values are affecting the mean.
- Review the sorted dataset: Arranging values from smallest to largest makes it easier to spot missing numbers, duplicates, or unusual entries.
- Choose the correct standard deviation: Use sample standard deviation when your data represents a sample, and population standard deviation when it represents the entire group.
- Keep decimal precision: Avoid rounding values before entering them if you need a more accurate result.
- Understand your data: An average summarizes a dataset, but it does not explain every difference between individual observations.
Reference: Which Average Should You Use?
Different statistical measurements are useful for different types of data. This table can help you choose the right one.
| Statistic | Best used for | Sensitive to outliers? |
|---|---|---|
| Arithmetic Mean | General average of numerical values | Yes |
| Median | Finding the middle value when data contains outliers | No, generally resistant |
| Mode | Identifying the most frequently occurring value | Not affected in the same way as the mean |
| Geometric Mean | Growth rates and multiplicative data | Sensitive to the values used |
| Harmonic Mean | Certain rates, speeds, and price-per-unit calculations | Sensitive to small values |
For most everyday calculations, the arithmetic mean is a good starting point. When your dataset contains unusual values or a wide distribution, reviewing the median and other statistics can provide a more complete understanding.
Frequently Asked Questions
How do I calculate an average percentage?
If all percentages represent the same scale and have equal importance, add them together and divide by the number of percentages.
For example, the average of 70%, 80%, and 90% is:
(70 + 80 + 90) ÷ 3 = 80%
If the percentages come from different total marks or carry different weights, use the total points earned divided by the total points possible, or calculate a weighted average.
How do I calculate the average percentage of marks?
For equally weighted subjects, add the percentage marks and divide by the number of subjects.
For example, if your scores are 75%, 80%, and 85%, the average is:
(75 + 80 + 85) ÷ 3 = 80%
If subjects have different maximum marks or credit weights, a simple average may not give the correct overall percentage. Use the actual marks and total possible marks or an appropriate weighted calculation.
How do I find the average of 3 numbers?
Add the three numbers together and divide the total by 3.
For example, the average of 4, 9, and 14 is:
(4 + 9 + 14) ÷ 3 = 27 ÷ 3 = 9
You can use the average calculator for three numbers or a much larger dataset.
What is an average calculator used for?
An average calculator finds the arithmetic mean of a set of numbers. This calculator also provides other statistical results, including the median, mode, range, standard deviation, and additional measurements.
Can I average negative numbers?
Yes. Negative numbers can be included in an arithmetic mean calculation. Add them to the other values using their negative signs, then divide the total by the number of values.
For example:
(10 + (−4) + 6) ÷ 3 = 12 ÷ 3 = 4
The average is 4.
What is the difference between mean and median?
The mean is calculated by adding all values and dividing by the number of values. The median is the middle value after sorting the numbers.
The mean can be affected by unusually high or low values, while the median is generally more resistant to outliers.
What is the mode of a set of numbers?
The mode is the value that appears most frequently in a dataset. A dataset can have one mode, more than one mode, or no mode if every value appears the same number of times.
What is standard deviation?
Standard deviation measures how spread out the values are around the mean. A smaller standard deviation indicates that values are closer to the mean, while a larger one indicates greater variation.
Should I use sample or population standard deviation?
Use sample standard deviation when your data represents part of a larger population. Use population standard deviation when your dataset includes every value in the population you want to describe.
Can this calculator find a weighted average?
This calculator is designed for simple averages, where each value has equal importance. A weighted average requires additional weight information and a different formula.
Can I enter numbers on separate lines?
Yes. The calculator accepts values separated by commas, spaces, or line breaks. This makes it easier to paste a list of numbers from a document or spreadsheet.
Calculate Your Average Quickly
Whether you are checking test scores, tracking monthly expenses, comparing business results, or analyzing a list of numbers, an average calculator makes the process easier.
Enter your values, choose the calculation settings, and review the results. You can find the mean, median, mode, range, and other statistical measurements without working through each formula manually.
Use the average calculator above to summarize your numbers and understand your data more clearly.