
Please provide numbers into average calculator to calculate the average of the numbers, median, and more.
About Average Calculator
An average calculator finds the arithmetic mean of a set of numbers but it can also tell you a lot more about that data than just one number. Enter a list of values (test scores, monthly expenses, daily temperatures, survey ratings, anything numeric) and the calculator returns the mean, along with the median, mode, spread, and several other statistics that give you a fuller picture of your dataset.
This tool is useful anytime you need to summarize a group of numbers: a teacher averaging grades, a student checking a semester GPA input, someone tracking weekly spending, a small business owner reviewing sales figures, or anyone who just wants to double-check a hand calculation. All you need before you start is the list of numbers you want to analyze nothing else is required.
Table of Contents
How to Use the Average Calculator
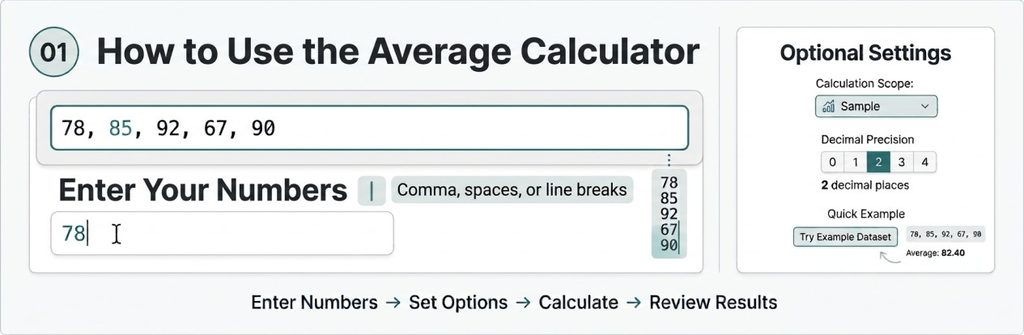
- Enter your numbers. Type or paste your values into the input box. You can separate them with commas, spaces, or line breaks the calculator reads all three formats, so you don’t need to reformat data copied from a spreadsheet or document. For example, 78, 85, 92, 67, 90 and a list with one number per line will both work the same way.
- Set the Calculation Scope (optional). If your dataset represents a full population (every value that exists say, every employee’s salary at a small company) rather than a sample drawn from a larger group, you can set the scope accordingly. This mainly affects the standard deviation calculation, covered below. If you’re not sure, leave it on the default (sample), which is the more common and more conservative choice for everyday use.
- Set Decimal Precision (optional). Choose how many decimal places you want in the results. Two decimal places is usually enough for grades or money; more precision helps with scientific or technical data where small differences matter.
- Try the Quick Example Dataset (optional). If you want to see how the calculator works before entering your own numbers, load the sample dataset. It’s a fast way to check that you understand what each result means.
A common mistake at this step is entering a stray non-numeric character (a currency symbol, a percent sign, a trailing comma) which can cause a value to be skipped or misread. Stick to plain numbers, and use a minus sign for negative values.
Understanding the Results
- Arithmetic Mean (Average)-This is the number most people are looking for. It’s the sum of all your values divided by how many values there are. It represents the “central” or typical value of the dataset, assuming the numbers are all counted equally.
- Sample Count (n)-Simply how many numbers you entered. This matters because the mean, and especially the standard deviation, depend heavily on how many data points went into them.
- Median (50th Percentile)-The middle value once your numbers are sorted from smallest to largest. If there’s an even number of values, it’s the average of the two middle ones. The median is useful because it isn’t pulled around by extreme outliers the way the mean is-one unusually high or low value barely moves it.
- Mode (Most Frequent)-The value (or values) that appear most often in your list. If every number appears exactly once, there is no mode, and the calculator will indicate that.
- Minimum / Maximum-The smallest and largest values in your dataset.
- Range (Max − Min)-The distance between your highest and lowest values. A large range suggests your data is spread out; a small range suggests it’s tightly clustered.
- Sample Standard Deviation (s)-A measure of how spread out your numbers are around the mean, calculated assuming your data is a sample taken from a larger population. This is the version to use in most everyday situations, since you rarely have every possible value.
- Population Standard Deviation (σ)-The same idea, but calculated assuming your list is the entire population, not a sample of it. It will always be slightly smaller than the sample standard deviation for the same data. Use this only when you’re certain your numbers represent every relevant value, not a subset of them.
- Interquartile Range (IQR)-The range covered by the middle 50% of your data (between the 25th and 75th percentile). It’s a way of measuring spread that, like the median, ignores extreme outliers.
- Geometric Mean-The average that results from multiplying all values together and taking the nth root, rather than adding and dividing. It’s used for data that grows multiplicatively, like investment returns or growth rates, and only works with positive numbers.
- Harmonic Mean-An average best suited to rates (like speed or price-per-unit), calculated from the reciprocals of your values. It gives more weight to smaller numbers, which matters when you’re averaging things like “miles per gallon” across trips of different lengths.
- Sorted Dataset-Your original numbers, arranged from smallest to largest, so you can visually confirm the calculator read your entries correctly.
The Formula
Arithmetic Mean: x̄ = (Σx) / n
The arithmetic mean is the most commonly used measure of central tendency in statistics.
Where:
- x̄ = the mean (average)
- Σx = the sum of all values in the dataset
- n = the number of values
Sample Standard Deviation: s = √[ Σ(x − x̄)² / (n − 1) ]
Population Standard Deviation: σ = √[ Σ(x − x̄)² / n ]
The only difference between the two is whether you divide by (n − 1) or n. Dividing by (n − 1) called Bessel’s correction slightly increases the result and produces a more accurate estimate of the spread of the full population when you only have a sample from it.
Geometric Mean: GM = (x₁ × x₂ × … × xₙ)^(1/n)
Harmonic Mean: HM = n / (1/x₁ + 1/x₂ + … + 1/xₙ)
The arithmetic mean is the right tool for the vast majority of everyday cases grades, expenses, scores, ratings. Reach for the geometric mean when you’re averaging rates of change or growth over time, and the harmonic mean when you’re averaging rates like speed, price per unit, or work rates.
Worked Example
Suppose a student has five test scores: 78, 85, 92, 67, 90.
Mean:
Sum = 78 + 85 + 92 + 67 + 90 = 412
Mean = 412 / 5 = 82.4
Sorted dataset: 67, 78, 85, 90, 92
Median: With 5 values, the median is the 3rd value in the sorted list = 85
Mode: No value repeats, so there is no mode.
Range: 92 − 67 = 25
Sample Standard Deviation:
Deviations from the mean (82.4): −4.4, 2.6, 9.6, −15.4, 7.6
Squared deviations: 19.36, 6.76, 92.16, 237.16, 57.76
Sum of squared deviations = 413.2
Sample variance = 413.2 / (5 − 1) = 103.3
Sample standard deviation = √103.3 ≈ 10.16
What this tells you: the average score is 82.4, the middle score is 85, and individual scores typically fall about 10 points away from the mean a reasonably tight spread for a set of test results.
Common Situations Where This Calculator Helps
- Grading and academics averaging test scores, quiz grades, or assignment results across a term.
- Budgeting finding your average monthly spending, utility bill, or income across several months.
- Performance tracking averaging weekly sales numbers, workout times, or productivity metrics.
- Surveys and ratings summarizing a set of customer or employee ratings into one representative number.
- Quick verification double-checking a manual average calculation, or a number produced by a spreadsheet formula.
- Understanding data spread, not just the average using the standard deviation or IQR to see whether your numbers are tightly clustered or widely scattered, which a single average figure can’t tell you on its own.
Common Mistakes
- Treating the mean as the only useful number. A high average can hide a few very low or very high outliers. Checking the median alongside the mean helps catch this if they’re far apart, your data likely has outliers or is skewed.
- Averaging percentages that came from different totals. If you’re averaging percentage scores that were calculated from different possible point totals (for example, one test out of 20 points and another out of 100), a simple average of the percentages can be misleading. See the comparison section below.
- Using population standard deviation when you actually have a sample. Most real-world datasets grades from one class, sales from one quarter are samples, not complete populations, so the sample standard deviation is usually the correct choice.
- Entering values with symbols or units attached (like “85%” or “$120”) instead of plain numbers, which can cause a value to be excluded from the calculation.
- Forgetting a value or duplicating one when copying numbers manually always compare the Sample Count (n) shown in the results against how many numbers you meant to enter.
Simple Average vs. Weighted Average
A simple average, which is what this calculator produces, treats every number equally. A weighted average gives some numbers more influence than others based on an assigned weight for example, a final grade where the final exam counts for 40% and homework counts for 10%. If your numbers don’t all carry equal importance, a simple average can produce a misleading result. This calculator is built for simple averages; if your numbers need different weights, they should be adjusted (multiplied by their weight and summed, then divided by the total weight) before or instead of using a straight average.
Accuracy, Assumptions, and Limitations
This calculator performs standard arithmetic and statistical formulas exactly as defined the math itself is not an estimate. However, a few things are worth keeping in mind:
- The result is only as good as the data you enter. A typo, a misplaced decimal, or a duplicated value will change every statistic the calculator produces.
- Rounding is applied for display. Depending on your decimal precision setting, results are rounded for readability; the underlying calculation uses full precision before rounding.
- Sample vs. population selection changes the standard deviation. Choosing the wrong scope won’t produce an “incorrect” number mathematically, but it will answer a slightly different statistical question than the one you intended.
- Geometric and harmonic means require positive numbers. If your dataset includes zero or negative values, these two results either won’t be meaningful or won’t be calculable, since both formulas involve division or roots that don’t work with non-positive numbers.
Practical Tips
- Check n before trusting the results. If the Sample Count doesn’t match how many numbers you meant to enter, go back and find the missing or extra value before reading anything else.
- Compare the mean and median. If they’re close, your data is fairly evenly distributed. If they’re far apart, a few outliers are likely pulling the mean in one direction-the median is a better “typical value” in that case.
- Use the sorted dataset to spot errors at a glance. A number that looks obviously out of place (like an extra zero) is much easier to catch once the list is sorted.
- Pick sample standard deviation unless you’re certain your list is the whole population. For grades in one class, prices at one store, or scores from one test, that’s almost always a sample.
Reference: Which Average Should You Use?
| Statistic | Best used for | Sensitive to outliers? |
| Arithmetic Mean | General-purpose average of comparable numbers | Yes |
| Median | Typical value when outliers or skew are present | No |
| Mode | Most common value in categorical or repeating data | No |
| Geometric Mean | Growth rates, investment returns, multiplicative data | Moderately |
| Harmonic Mean | Rates like speed, price per unit, or efficiency | Moderately |
Frequently Asked Questions
How do I calculate an average percentage?
If your percentages already represent the same scale (for example, five test scores each already expressed as a percentage of 100), you can average them directly using the same method as any other set of numbers: add them up and divide by how many there are. However, if the percentages came from different totals say, a quiz worth 10 points and an exam worth 100 points averaging the percentages directly can distort the result. In that case, add the actual points earned, add the actual points possible, then divide the total points earned by the total points possible.
How do I calculate the average percentage of marks?
For marks or grades across several subjects that are each already expressed as a percentage and carry equal weight, simply enter each percentage into the calculator and use the mean result. If subjects carry different weights (for example, a major subject count more than an elective), you’ll need a weighted average instead of a simple one.
How do I find the average of 3 numbers?
Add the three numbers together and divide by 3. For example, the average of 4, 9, and 14 is (4 + 9 + 14) / 3 = 27 / 3 = 9. This calculator handles any number of values, including just three.
What is the average of these number’s calculator?
It’s exactly this tool enter any list of numbers and it returns the mean, along with the median, mode, range, standard deviation, and other statistics that describe your dataset.
Can you average negative numbers?
Yes. Negative values are added into the total the same way positive ones are — a negative number simply reduces the sum. For example, the average of 10, −4, and 6 is (10 + (−4) + 6) / 3 = 12 / 3 = 4.
Related Tools
If you’re working with grades specifically, the GPA Calculator converts letter grades and credit hours into a grade point average, which is a different calculation from a simple numeric mean. If you need to work out a percentage change, a percentage of a total, or convert a fraction to a percentage, the Percentage Calculator is built for that. For more Mathematical calculators.