
Add multiple people to visually compare their heights side by side on an accurate proportional scale.
Manage People & Measurements
Customize names, heights, silhouettes (Man or Woman), and colors. Up to 20 people allowed.
About Height Comparison Visualizer
The Height Comparison Visualizer puts people side by side on one chart, drawn to the same scale. You enter each person’s height, give each one a body color, and see right away who is taller and by how much. You can add up to 20 people, so it works for two siblings, a whole team, or a family photo lineup.
It is a visualization tool, not a calculator. The result is a picture you read, not a single number you copy. That makes it useful for judging how a gap in inches or centimeters looks in real life. All you need is each person’s height in feet and inches or in centimeters.
Table of Contents
How to Use the Height Comparison Visualizer
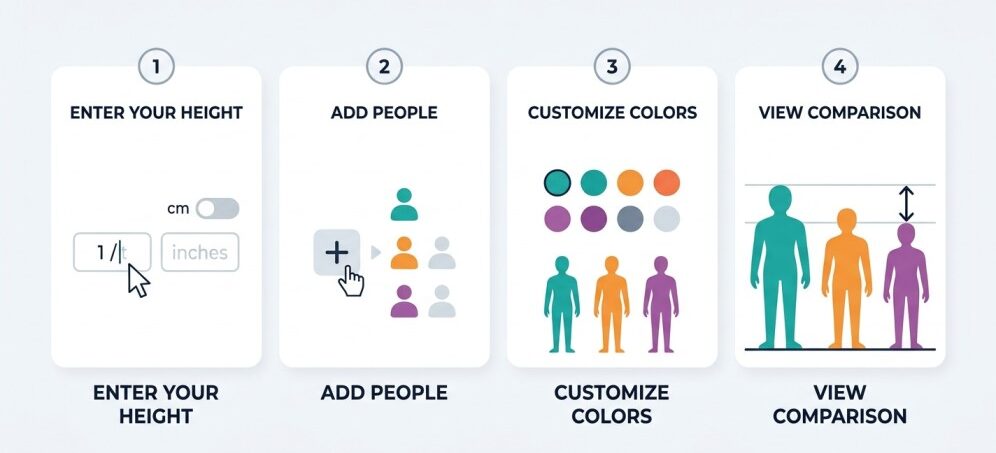
- Enter the first person’s height. Choose feet and inches or centimeters, then type the value. Use the person’s real standing height, not a rounded guess. Entering 5’9″ for someone who is 5’11” distorts every comparison involving them.
- Add the next person. Repeat for each person, up to 20. If you switch units between people, keep an eye on the numbers. A common slip is typing 170 in a feet field or 5.8 in a centimeter field.
- Pick a color for each body. The colors are there so you can tell people apart. Give your own figure a strong contrasting color and use softer shades for everyone else.
- Read the chart. Bodies stand on a shared baseline, so the top of each figure shows where that person’s head ends. The tool also reports how much taller or shorter each person is.
Note that “5.10” and 5’10” are not the same thing. If you type 5.10 into a feet field, you may be entering five and one-tenth feet, which is about 5’1″. Always enter feet and inches in their separate fields where the tool provides them.
Reading the Chart and the Difference Results
Two things are shown together: a body chart and a height difference.
The body chart shows each person scaled to their entered height. If one person is 10% taller than another, their figure is 10% taller on screen. This is why the chart is more intuitive than reading two numbers. A 4-inch gap sounds small until you see two people standing next to each other and notice where one person’s eyes line up with the other’s forehead.
The difference result tells you how much taller or shorter one person is than another, as a plain measurement. This is simply the larger height minus the smaller one.
One thing the chart does not show is weight or build. Heights are drawn on a single vertical scale, so a tall slim person and a tall broad person will look the same except for height. If you were hoping for a weight and height comparison chart, this tool compares height only. Body weight, body mass index, and proportions are separate questions.
The Math Behind the Difference
The visualizer only needs two small conversions and one subtraction.
Formulas:
- Total inches = (feet × 12) + inches
- Centimeters = total inches × 2.54
- Height difference = taller height − shorter height
- Percent taller = (difference ÷ shorter height) × 100
Here, 12 is the number of inches in a foot, and 2.54 is the exact number of centimeters in an inch. The percentage is worth knowing because it is not symmetrical. If A is 9.4% taller than B, B is only about 8.6% shorter than A, because the two percentages use different starting points.
Worked Example
Say you want to compare three people: Maya at 5’4″, Daniel at 5’10”, and Chris at 6’2″.
Step 1: Convert to inches.
Maya: (5 × 12) + 4 = 64 in
Daniel: (5 × 12) + 10 = 70 in
Chris: (6 × 12) + 2 = 74 in
Step 2: Convert to centimeters.
Maya: 64 × 2.54 = 162.56 cm
Daniel: 70 × 2.54 = 177.8 cm
Chris: 74 × 2.54 = 187.96 cm
Step 3: Find the differences.
Daniel − Maya = 70 − 64 = 6 in (15.24 cm)
Chris − Daniel = 74 − 70 = 4 in (10.16 cm)
Chris − Maya = 74 − 64 = 10 in (25.4 cm)
Step 4: Percent taller than Maya.
Daniel: 6 ÷ 64 × 100 = 9.375%, so about 9.4% taller
Chris: 10 ÷ 64 × 100 = 15.625%, so about 15.6% taller
On the chart, Maya’s head would sit at roughly Daniel’s chin or shoulder level, and Chris would stand a full 10 inches above her. The two gaps (6 inches and 4 inches) are different, and the chart makes that easy to see at a glance.
When People Use a Height Comparison Tool
- Family and friend comparisons. Seeing how tall a teenager has become next to a parent is more fun on a chart than in a notebook.
- Dating profiles and meeting someone. Many people want a sense of how they would line up next to a person listed at a certain height.
- Writing and character design. Authors, game designers, and artists need characters whose heights feel believable next to each other.
- Costume, photo, and group planning. For a group photo, a team lineup, or a stage setup, you can check in advance who will stand where.
- Checking a figure, you read online. If a profile lists someone at 6’0″, you can place that number against your own height and see what it really means.
Common Mistakes
- Mixing units without noticing. Typing centimeters into a feet field (or the reverse) gives an absurd result. If a figure looks wildly tall or tiny, check the unit first.
- Using shoe height. Footwear can add roughly an inch or more. For a fair comparison, measure everyone barefoot, or measure everyone in shoes.
- Using stated heights as if they were measured. Many people round up. A height someone says out loud may not match what a wall measurement shows.
- Treating “5.5” as 5’5″. In decimal feet, 5.5 ft is 5’6″. In feet and inches, 5’5″ is 65 inches.
- Reading the percentage backward. As shown above, “taller by X%” and “shorter by X%” are different numbers.
Accuracy, Assumptions, and Limitations
The chart is only as accurate as the heights you type in. The tool scales whatever you enter, so any error in the input carries straight into the picture. The figures are generic body shapes. They show height proportionally, but they do not reflect a person’s build, posture, hairstyle, or stance, so use the chart as a height reference, not a portrait. Standing posture also matters in real life: slouching can easily cost a person an inch or more.
Height is not perfectly constant either. People are commonly a little taller in the morning than at the end of the day, because the spine compresses slightly during waking hours. The difference is small, but it can matter if you are comparing two people who are only an inch apart. Finally, the tool compares height only. It does not predict growth, estimate adult height from a child’s height, or tell you whether a height is “average” for someone’s age.
Practical Tips
- Measure against a flat wall. Stand barefoot with heels, hips, and shoulders touching the wall, look straight ahead, and mark the top of the head with a flat object such as a book held level. Measure from the floor to the mark.
- Use the same measurement conditions for everyone. If you can only get one person’s height in the morning, avoid comparing them against someone measured at night when the gap is under an inch.
- Put your own figure in a strong color. On a crowded chart with many people, a single bold color makes it easy to find yourself.
- Check the biggest gap first. If the tallest and shortest person on the chart are separated by an unexpected amount, one of the entries is probably a unit or typing error.
Height Reference Table
Common U.S. heights and their metric equivalents, using 1 in = 2.54 cm:
| Feet and inches | Total inches | Centimeters |
| 5’0″ | 60 | 152.4 |
| 5’4″ | 64 | 162.6 |
| 5’6″ | 66 | 167.6 |
| 5’8″ | 68 | 172.7 |
| 5’10” | 70 | 177.8 |
| 6’0″ | 72 | 182.9 |
For context, the CDC’s measured average heights for U.S. adults are about 68.9 inches for men (5’8.9″) and 63.5 inches for women (5’3.5″). Try adding those two figures to the visualizer next to your own to see where you stand.
Frequently Asked Questions
How much taller is 6’0″ than 5’6″?
Six feet is 72 inches and 5’6″ is 66 inches, so the difference is 6 inches, or 15.24 cm.
How many people can I compare at once?
Up to 20. That is enough for a family, a sports team, or a classroom row.
Does the tool show weight?
No. It compares height only. The body shapes are for scale, not body composition.
Can I enter heights in centimeters and feet in the same comparison?
Yes, you can enter each person in whichever unit suits you. Just be careful that the unit you pick matches the value you type.
How big a height difference is actually noticeable?
That varies from person to person, and there is no official threshold. In person, a gap of around 2 inches (5 cm) is usually easy to see when two people stand close together, while a gap of an inch or less often disappears with posture or shoes.
Why does my height look different on the chart than in a photo?
Photos distort height depending on camera angle, distance, and lens. A scaled chart does not, so it is the more reliable reference.
Is the chart accurate for children?
It is accurate for whatever height you enter, but children’s heights change quickly, so a comparison is only true for the date of the measurement.
Related Tools
If you want to compare something other than people, our Hand Size Comparison tool does the same kind of side-by-side view for hand length and palm width. For gadgets and home setups, the Screen Size Comparison, TV Size Comparison, Monitor Size Comparison Tool, and Curved Monitor Size Visualizer work on the same idea of seeing real proportions instead of reading numbers. check out for more Size & Comparison Tools.